
Modeling the user engagement with Visionair | 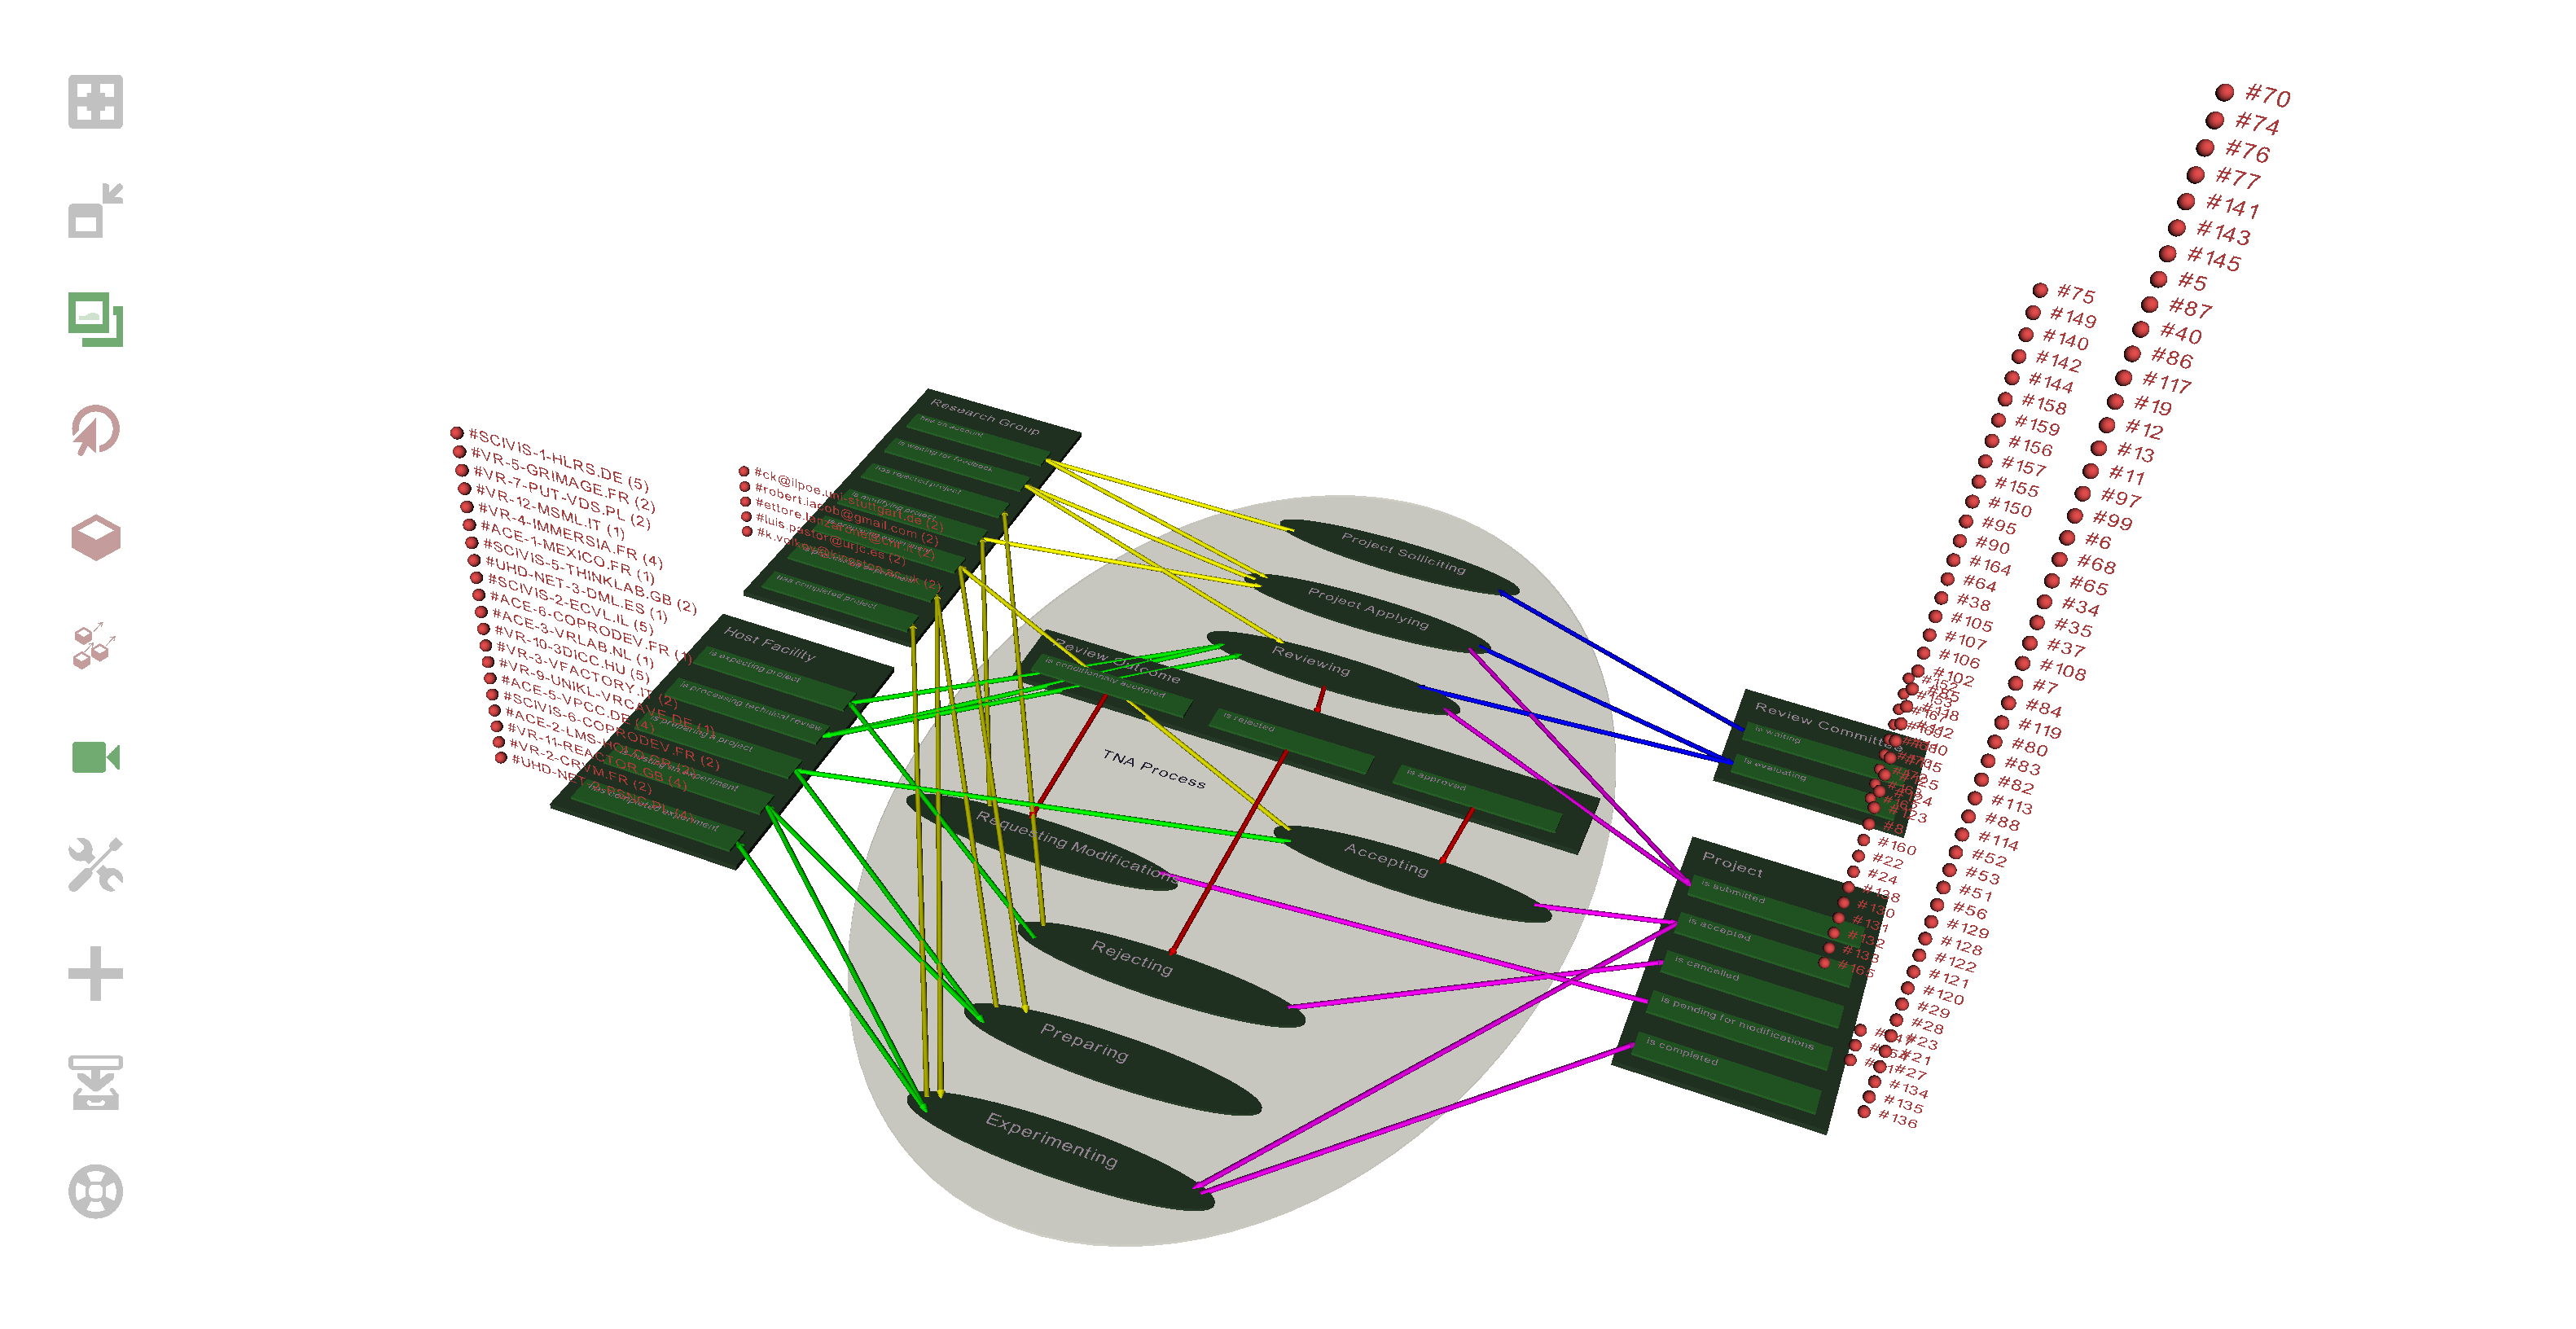 |
Research action summary :
The action has been managed into two steps corresponding to the two sub research questions mentioned above.
- Modeling of TNA process using the OPM framework (Figure 2). A team of students from Technion was in charge to translate an oral definition of the process presented by the Visionair scientific coordinator into the OPM framework. This task was the opportunity to enter deeply in the TNA process and to get a better overall comprehension of the corresponding sub-tasks. We obtained a conceptual model of the TNA process. The top level of this model can be seen in figure 2.
- Instance representations : this step is an original point. When observing the created process instances, even if the conceptual model is quite clear, the visualisation of more than 200 projects make the perception of instances very hard. That is why the conceptual model is used and extruded in a 3D representation (Figure 3). By this we extend OPM and allow direct and tangible perception of projects.
The OPM models has the ability to represent on the same graph both, the process and the objects handled by the process with their various status which makes a clear understanding of the potential evolution of the objects. Project, Review Committee, Host Facility and Research Group are the four main objects participating to the process. In 2D the arrows clearly highlight the activities that can change an object state into another state. But if we expect to create an instantiation diagram then the corresponding graph should include the 200 projects, all the review committee members, the 29 Visionair host facilities and about 200 external research groups which submit projects. This graph will not be readable.
Thus OPM is perfect to get an abstract view of the overall process but does not provide a correct solution for instance visualisation. We extended the view by extruding the OPM 2D graph in the third dimension with in front of every object state the corresponding instances. The system was also enrich with some interaction behaviours which support selection of state object which must be visualized (Figure 1).
We tested this new representation of the instance model:
- on an holographic screen : too low resolution to read the strings of instances
- On a HD stereoscopic display : 3D perception allow a very good perception and navigation (Figure 4)
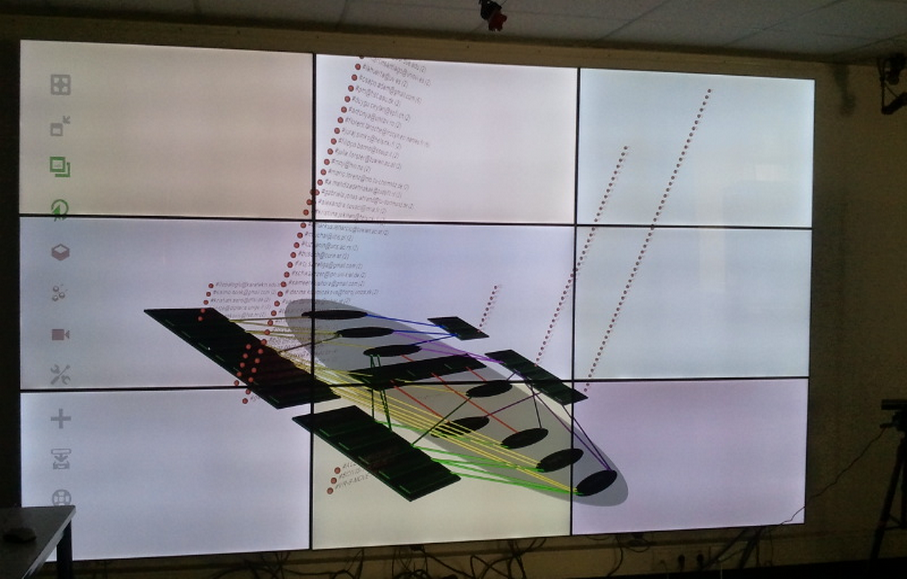
- On a 6K 2D display (3x3 HD display matrix) : the quality of strings is much higher and is a real improvement but does not compensate the added value of 3D perception
In conclusion this 3D representation may be a real added value for huge data set perception. Any as soon as text is visualized a ultra high resolution is expected to be able to read this texts. Sterescopy is a clear advantage to perceive relative positions in the 3D scenes. A The use of such representation should be adequate with UHD 3D stereoscopy displays.
Research question :
Context :
we are facing huge information data-set modelling the instantiation of a specific process. Indeed when we are facing huge information data-set which refers the instanciation of a specific process, we are usually embarrassed in providing an holistic vision of the execution of this process.
To fix ideas we decided to work on the VISIONAIR Transnational Access project. A data-base was created when starting VISIONAIR infrastructure to support project submissions and follow every project : the VAM data-base. As usually the data base is accessed through a traditional web portal and we can navigate within tables of information. Every submitted project is an instance that evolves other the time. Every project step is marked through a status attribute. Figure 2 presents the current presentation of a table. Currently more than 200 instances are registered which makes an holistic view of projects just impossible. Within VISIONAIR a committee review is expected to decide which projects are accepted and expects to get this holistic process view.
The Object Process Model paradigm has been developped at Technion. OPM is a holistic graphical and textual methodology to represent and enhance comprehension of a specific process. It has the rare ability to integrate on a same diagram a process definition and object definition. OPM diagrams can be translated into natural langage (english). Anyhow as for many meta-model solution OPM structures a model but does not provide an easy vision of instances of this model unless a simulator can be played. The research questions of this action can be summarised in 2 sub-points:
- is OPM operational to model the VISIONAIR TNA process and support an easy understanding of this process?
- may we extend semantics of OPM to support a clear representation of processes instances?
Task and deliverables :
This action was concerned by conceptual modelling of the TNA process which is a clear action of WP11. The task 11.1 and 11.2 are clearly connected to this action or this action partipate to both. D11.6 « Final report of conceptual modeling and human-centered aspects of visualization » du at month 48 is a rigth deliverable to report this action.
Involved partners :
Technion, Grenoble-INP
Publications :
- Wengrowicz, N., Dori, Y.J., & Dori, D. (2014). Transactional Distance in an Undergraduate Project-based Systems Modeling Course. Knowledge-Based Systems. DOI http://dx.doi.org/10.1016/j.knosys.2014.05.022
- Papers in Published Refereed International Conference Proceedings Wengrowicz, N., Dori, Y.J., & Dori, D. (2012). Global Collaboration and Transactional Distance - Development of a TD Assessment Instrument for the VISIONAIR Project. Proceedings of CogInfoCom 2012, 3rd IEEE International Conference on Cognitive Infocommunications, Dec. 2-5, Kosice, Slovakia, pp. 255-259. DOI 10.1109/CogInfoCom.2012.6421989.
- Papers Presented at Professional Conferences Niva Wengrowicz, Dov Dori and Yehudit Judy Dori, Visualization-Based Collaboration and Transactional Distance among Students in a Mini-Project in Industrial Engineering Course. Paper presented at the National Association for Research in Science Teaching (NARST) Annual International Conference, Rio Grande, Puerto Rico, April 6-9, 2013.
- One publication is planned in 2015 to present the current 3D solution.
Related TNAs :
This action investigates how to manage huge data set. All the TNA projects are in a sense impacted by this new service. Indeed it can be viewed as a dashboard for the committee review to follow projects and rapidly highlight the states of projects. Currently we do make it as operational for the main rationale that 3D equipment cannot be used during committee review meetings. We should share a common view and in the best time we just use conventional 2D video-conference system. This issue is not new and the solution proposed here is a new direction than the usual one which try to immerse people in a very huge graph as investigated in TNA17 : " Visually augmented analysis of information evolution in design" where the graph of information created in a PLM system was fully visualized for immersion of the person in charge to assess this graph.
Illustrations :
Figure 1 Visualization of instances of the OPM model in the 3D view : In this view, any object state can be selected/unselected, switching on and off the instances in this state. The IDs on the right of completed and accepted project are easily accessed while (on the left) the facilities hosting the completed projects are also listed.
Figure 2 Initial 2D representation as an OPM diagram of the TNA process. Rectangle are Objects with potential states definition-, ellipses are Processes. Object states are consumed by processes and the output of a process is a new object state.
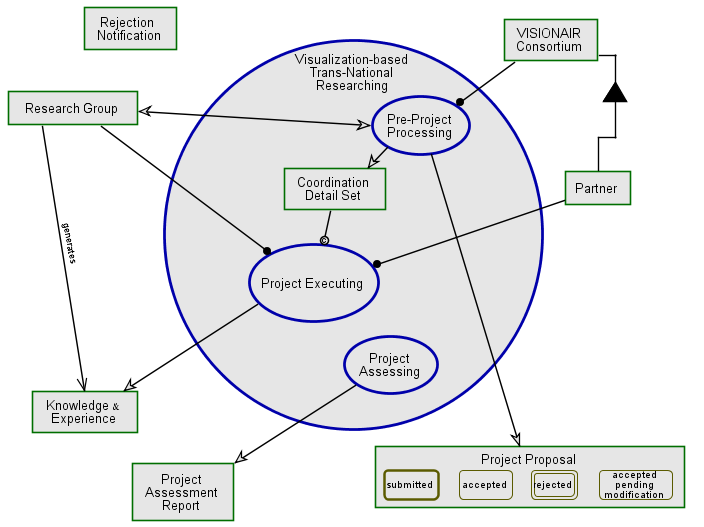
Figure 3 Final 3D representation as an OPM diagram of the TNA process ithin a 3D viewer : Rectangle are Objects with potential states definition-, ellipses are Processes. Object states are consumed by processes and the output of a process is a new object state. Here every objects have been detailed with all their potential states and the process is completely defined. The 3D view does not provide any added value here.
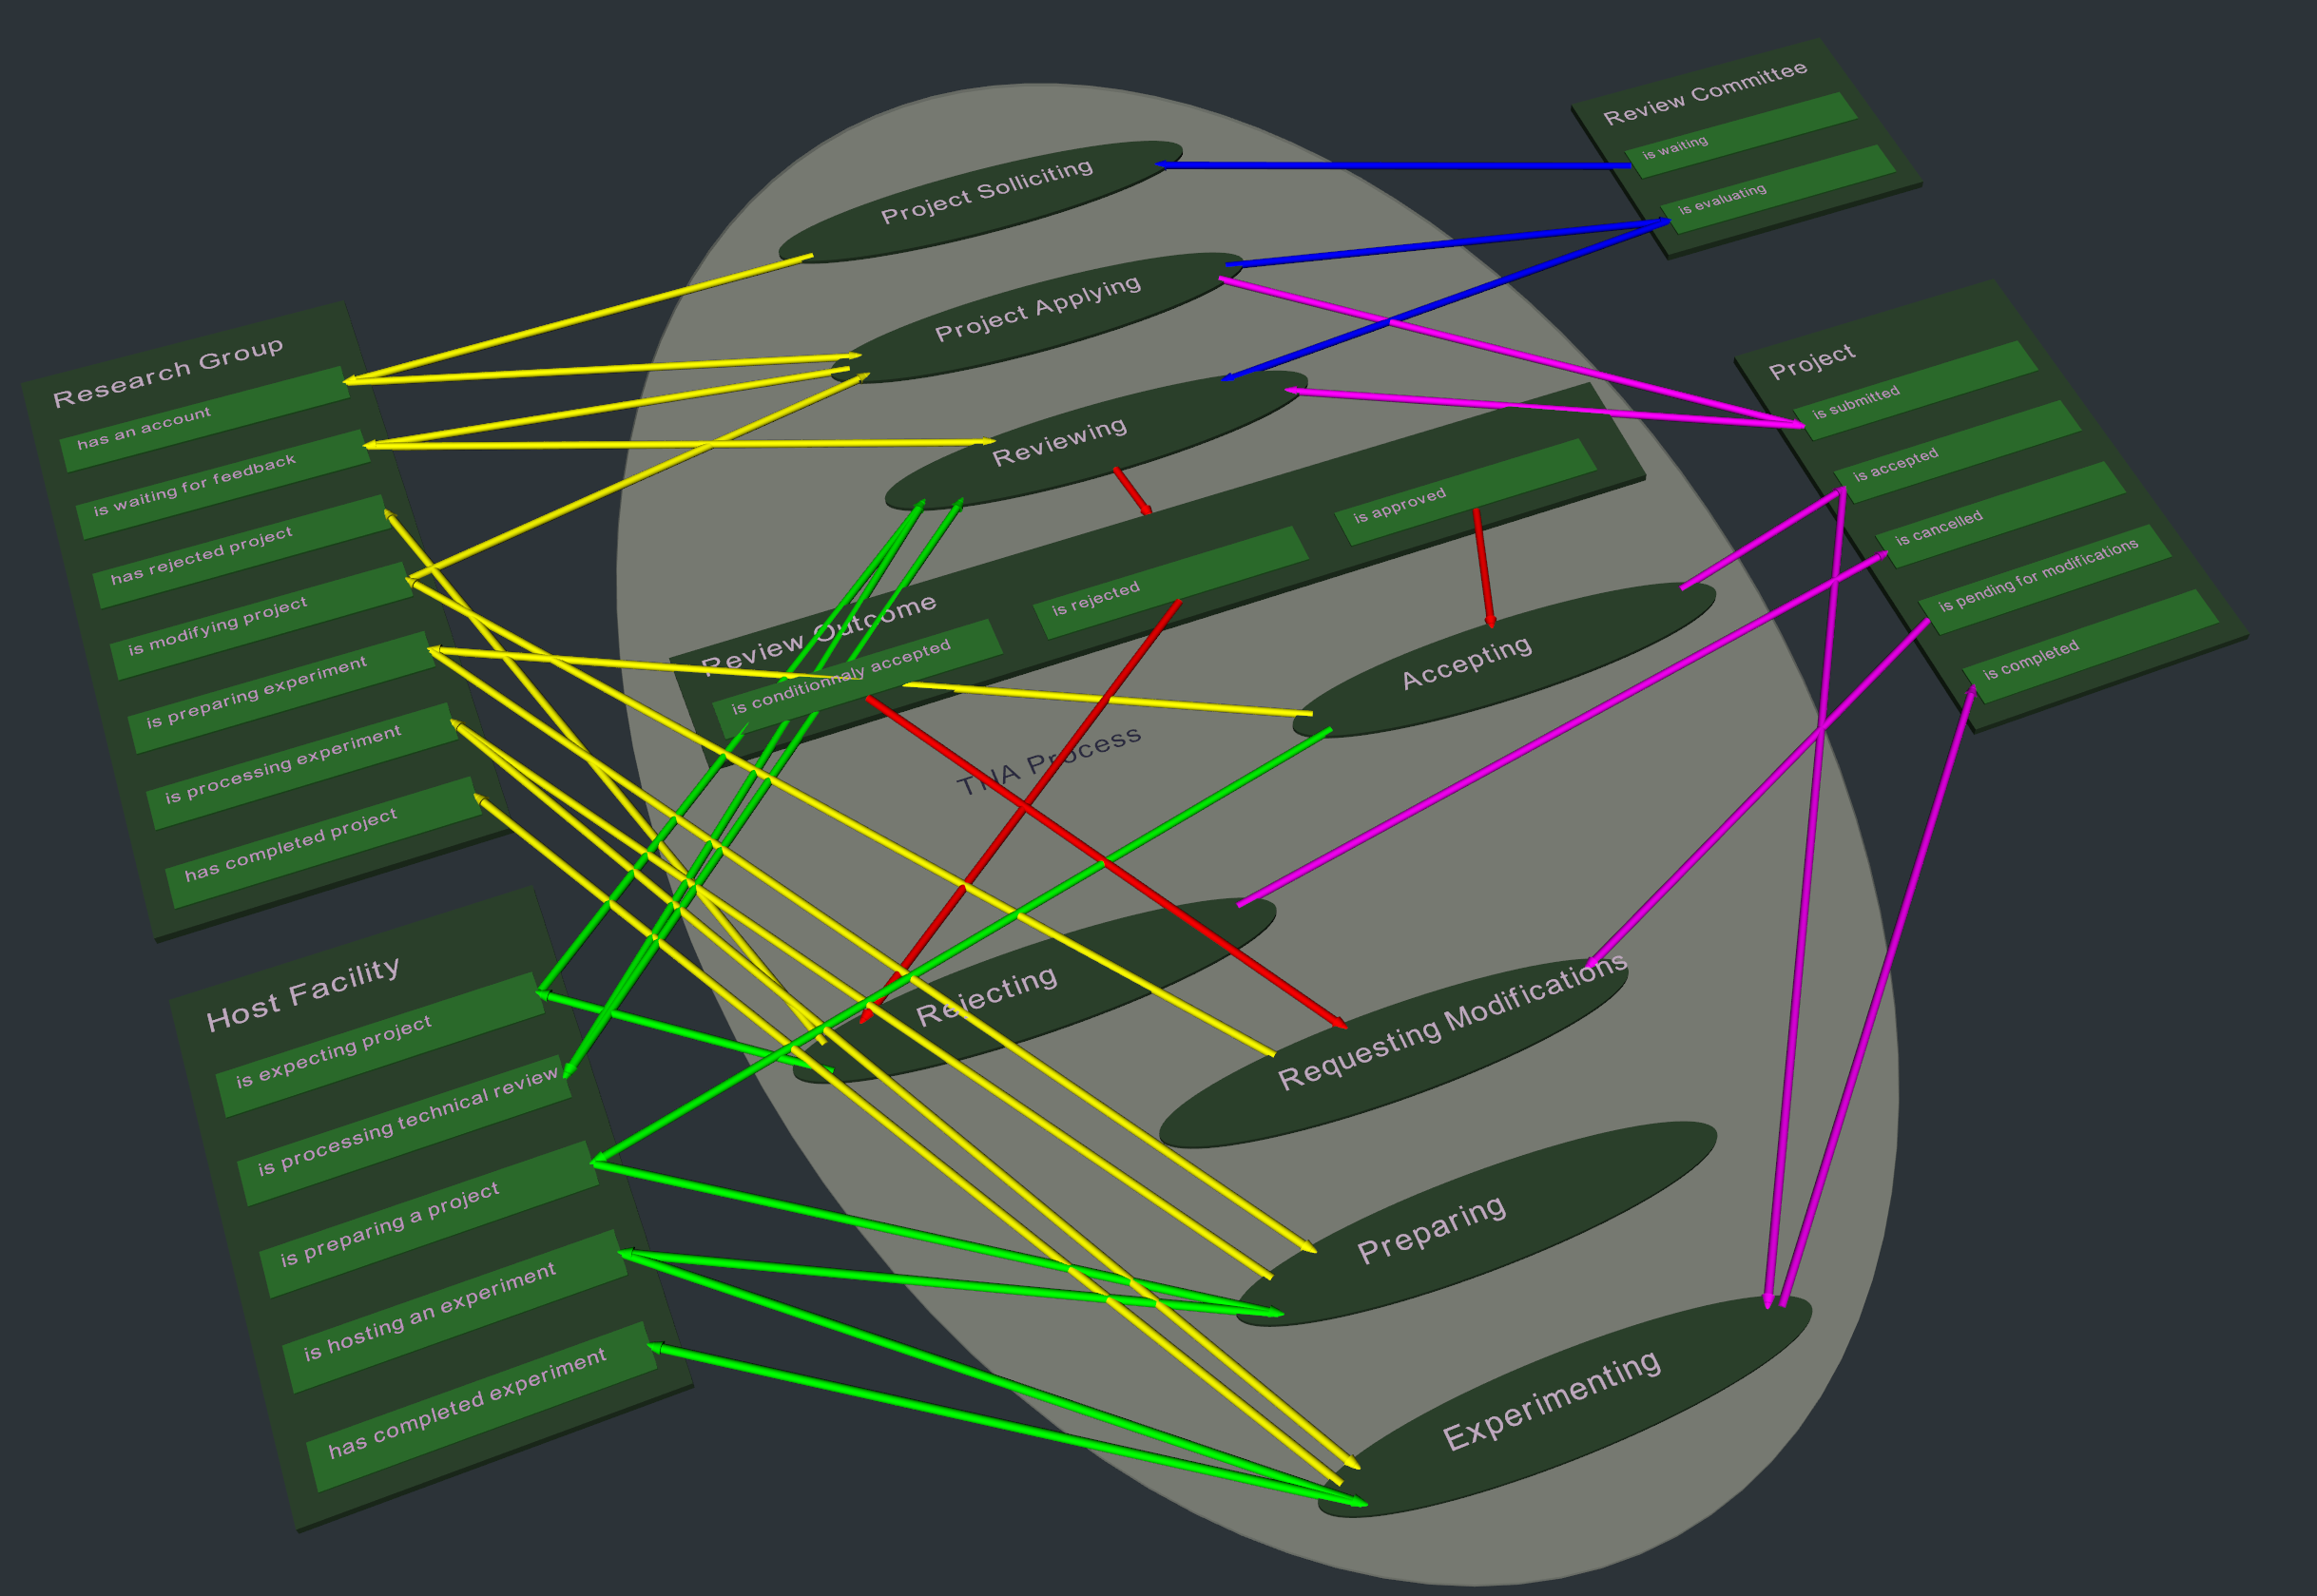
Figure 4 3D Visualization of instances of the OPM model on a 2D power wall : We tested this visualization on several displays. It is hard to demonstrate on a paper sheet 3D stereoscopic view which has been assessed but the current picture highlights on a power wall. When a lot of strings are displayed this power wall allow a better perception of strings since the resolution is higher. A correct reading is proposed. On a 3D stereoscopic view a better perception of instances positions respect to the OPM model is obtained.
.

VISIONAIR / Grenoble INP / 46 avenue Felix Viallet / F-38 031 Grenoble cedex 1 / FRANCE
Project funded by the European Commission under grant agreement 262044
Project funded by the European Commission under grant agreement 262044