
Title : Visually augmented analysis of information evolution in design
Project Lead : Tino Tino Stankovic From : Faculty of Mechanical Engineering and Naval Architecture (None)
Dates : from 2012-02-01 00:00:00 to 2015-01-12 10:38:42
Description :
Motivation and objectives :
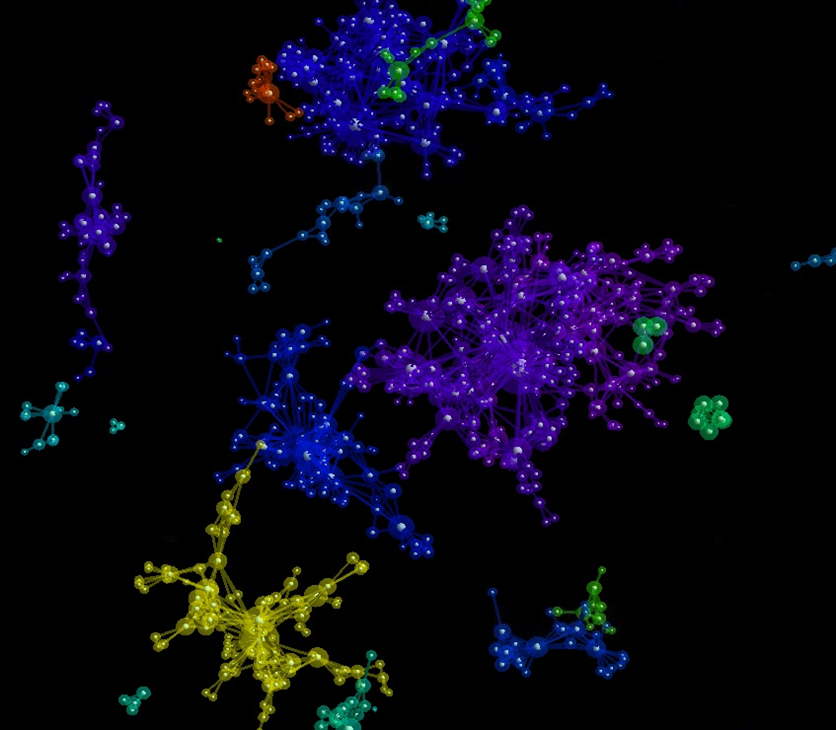
Visual representation and analysis of information evolution is a method by which the technology can augment human capabilities in order to meet the challenges of management of complex information structures. The research in cognitive psychology established that it is much easier to process complex structures if visually displayed than to rely on the limited capacities of working memories (Ware 2004). Augmenting natural ability to deal with large complex digital repositories of information objects is achieved when suitable visualisation technique is applied to foster interpretation of their content and context. Building on these human-centred characteristics, modern computer based visualisation tools offer environments for effective complex information dependency analysis. User friendly graphical interfaces backed with underlining algorithms through which information context and content evolution can be visualised as spatially organized and interactive will improve both the information understanding for retrieval and reuse process. In order to provide a more effective understanding of both the content and context of the information evolution and its traceability for the engineering design and development application domains, a TRENIN project (TRaceability of ENgineering INformation TRENIN framework (www.trenin.org) funded by EUREKA program, resulted with development of semantic traceability records as a network of traceability elements and objects interconnected by semantic links of different types and strengths. The idea of the semantic traceability records is to identify, represent and capture the physical and abstract concepts from the system design domain relevant for description of the information object content and context evolution. Among the other results, the project also yield in a Java based TRENIN Visualisation Toolkit which was developed within the Processing visualisation environment (www.processing.org). The purpose of the TRENIN Visualisation Toolkit is to visually describe recorded evolution of information content and context thereby utilizing both the semantic network of the information objects and predefined traceability elements instantiated based upon predefined ontology. The visualisation was realized upon an organic information visualisation paradigm which employs simulated organic properties in an interactive, visually refined environment to collect qualitative facts from large bodies of quantitative data generated by information evolution dynamics. Additional application of various layout algorithms and semantic filters to display complex structure of traceability record in 2D helped out in identification and analysis of information evolution patterns. To complement semantic graph view mode a 2D/3D matrix based visual interpretation of information evolution is being provided for dependency analysis in design of complex systems. To continue further the development we propose generalisation of the TRENIN Visualisation Toolkit in order to become a generic tool for complex structures of information evolution. To accomplish that, the following objectives should be met: Real-time large information network layout evolution applying various graph drawing techniques, i.e. force-directed approach for general graphs or hierarchical approach for acyclic digraphs, to convey the relevant meaning by displaying appropriate network layouts. On-the-fly evolution of the properties of a large information network (degree, centrality, diameter, modularity, clustering etc.) augmented with appropriate computer graphics based effects performed on network's entities to emphasize property in-time change. To perform search on large-scale information networks and to record and observe the evolution of emerging processes and effects taking place on networks such as reaching the information network's transition points at respective evolution steps, or formations of giant clusters and modules. To test out the extension of a 2D evolution visualisation of complex information structures into 3D which would bring more clarity in the visualisation allowing (i.e. no edges/links crossings). Furthermore the 3D representations allow space navigation against planar only in 2D, which should enable the user to more efficiently focus on clustered network portions.
Teams :
Faculty of Mechanical Engineering and Naval Architecture (FMENA) at University of Zagreb (UniZg) is hosting the Chair of Design and Product Development. As applicants for the VisionAir project they will bring their competencies on implementation and customisation of the advanced CAD and PLM tools and methods, product and design process formal modelling, design knowledge and information management and computational design synthesis gained from the research and industrial projects in Croatia and abroad. In addition, they have experience and well established relationships to European centres of excellence in the field of engineering design gained from the collaboration on joint projects and organization of the research and development events for the academia and industry that are recognized and appreciated worldwide (www.designconference.org). Chair of Design and Product Development possesses a broad experience in the field of information modelling for engineering design domains including recently completed project on traceability of information evolution (www.trenin.org) during which a prototype visualisation tool for information evolution that was implemented. CADLab - Computer Aided Design Laboratory as an operational unit of the Chair offers wide range of the state-of-the art IT technology used in modern product development process (CAD, PDM, PLM) that serves as an IT platform necessary for research and development of the integration of the information evolution framework and existing engineering tools. Besides, existing hardware and software audio-video conference facilities and distant collaboration tools available in CADLab can provide communication platform for distributed research and development.
Dates :
starting date : 19 November, 2012
ending date : 29 November, 2012
Facilities descriptions :
http://visionair-browser.g-scop.grenoble-inp.fr/visionair/Browser/Catalogs/VR-LAB-RWTH.DE.html
Recordings & Results :
Visual representation and analysis of information evolution is a method by which the technology can augment human capabilities in order to meet the challenges of management of complex information structures. The research in cognitive psychology established that it is much easier to process complex structures if visually displayed than to rely on the limited capacities of working memories (Ware 2004). Augmenting natural ability to deal with large complex digital repositories of information objects is achieved when suitable visualisation technique is applied to foster interpretation of their content and context. Building on these human-centred characteristics, modern computer based visualisation tools offer environments for effective complex information dependency analysis. User friendly graphical interfaces backed with underlining algorithms through which information context and content evolution can be visualised as spatially organized and interactive will improve both the information understanding for retrieval and reuse process. In order to provide a more effective understanding of both the content and context of the information evolution and its traceability for the engineering design and development application domains, a TRENIN project (TRaceability of ENgineering INformation TRENIN framework (www.trenin.org) funded by EUREKA program, resulted with development of semantic traceability records as a network of traceability elements and objects interconnected by semantic links of different types and strengths. The idea of the semantic traceability records is to identify, represent and capture the physical and abstract concepts from the system design domain relevant for description of the information object content and context evolution. Among the other results, the project also yield in a Java based TRENIN Visualisation Toolkit which was developed within the Processing visualisation environment (www.processing.org). The purpose of the TRENIN Visualisation Toolkit is to visually describe recorded evolution of information content and context thereby utilizing both the semantic network of the information objects and predefined traceability elements instantiated based upon predefined ontology. The visualisation was realized upon an organic information visualisation paradigm which employs simulated organic properties in an interactive, visually refined environment to collect qualitative facts from large bodies of quantitative data generated by information evolution dynamics. Additional application of various layout algorithms and semantic filters to display complex structure of traceability record in 2D helped out in identification and analysis of information evolution patterns. To complement semantic graph view mode a 2D/3D matrix based visual interpretation of information evolution is being provided for dependency analysis in design of complex systems. To continue further the development we propose generalisation of the TRENIN Visualisation Toolkit in order to become a generic tool for complex structures of information evolution. To accomplish that, the following objectives should be met: Real-time large information network layout evolution applying various graph drawing techniques, i.e. force-directed approach for general graphs or hierarchical approach for acyclic digraphs, to convey the relevant meaning by displaying appropriate network layouts. On-the-fly evolution of the properties of a large information network (degree, centrality, diameter, modularity, clustering etc.) augmented with appropriate computer graphics based effects performed on network's entities to emphasize property in-time change. To perform search on large-scale information networks and to record and observe the evolution of emerging processes and effects taking place on networks such as reaching the information network's transition points at respective evolution steps, or formations of giant clusters and modules. To test out the extension of a 2D evolution visualisation of complex information structures into 3D which would bring more clarity in the visualisation allowing (i.e. no edges/links crossings). Furthermore the 3D representations allow space navigation against planar only in 2D, which should enable the user to more efficiently focus on clustered network portions. Research Question: What level of performance of current TRENIN Visualization Toolkit involving layout, analysis and clustering algorithms is achieved on advanced computational hardware and real life large scale data sets? Does the 3D force field layout algorithm applicable for a large scale networks? Are the behavioural properties of large scale information networks encountered in engineering design domains comparable to behavioural properties found in small networks of same type? Does the proposed visualization tool backed with advanced visualization technology and computational resources truly augments users cognitive capabilities to process and analyze large amounts of information given by the network? Scientific Challenges: Scientific challenges can be summarized by the following: An opportunity to visualise and analyse the behaviour of large scale complex information networks evolution. To test out the limits, the applicability and advantages of available advanced visualisation technology when augmenting human capabilities in large scale networks analysis. To explore the possibilities for prediction of complex information network's behaviour based on the recorded data organized as bi-partite/n-partite graphs (i.e. preference networks and recommender systems). To test out the performance of parallel CPU Cluster or GPU based algorithms for visualisation and analysis when run on the VisionAir's computational resources.
Conclusions :
Software installation and ajustments finised. Evaluation and discuss of the results
Project Images :
.

VISIONAIR / Grenoble INP / 46 avenue Felix Viallet / F-38 031 Grenoble cedex 1 / FRANCE
Project funded by the European Commission under grant agreement 262044
Project funded by the European Commission under grant agreement 262044